Performance Analyzer
Performance Analyzer is an agent and REST API that allows you to query numerous performance metrics for your cluster, including aggregations of those metrics, independent of the Java Virtual Machine (JVM). PerfTop is the default command line interface (CLI) for displaying those metrics.
To download PerfTop, see Download on the Open Distro for Elasticsearch website.
You can also install it using npm:
npm install -g @aws/opendistro-for-elasticsearch-perftop
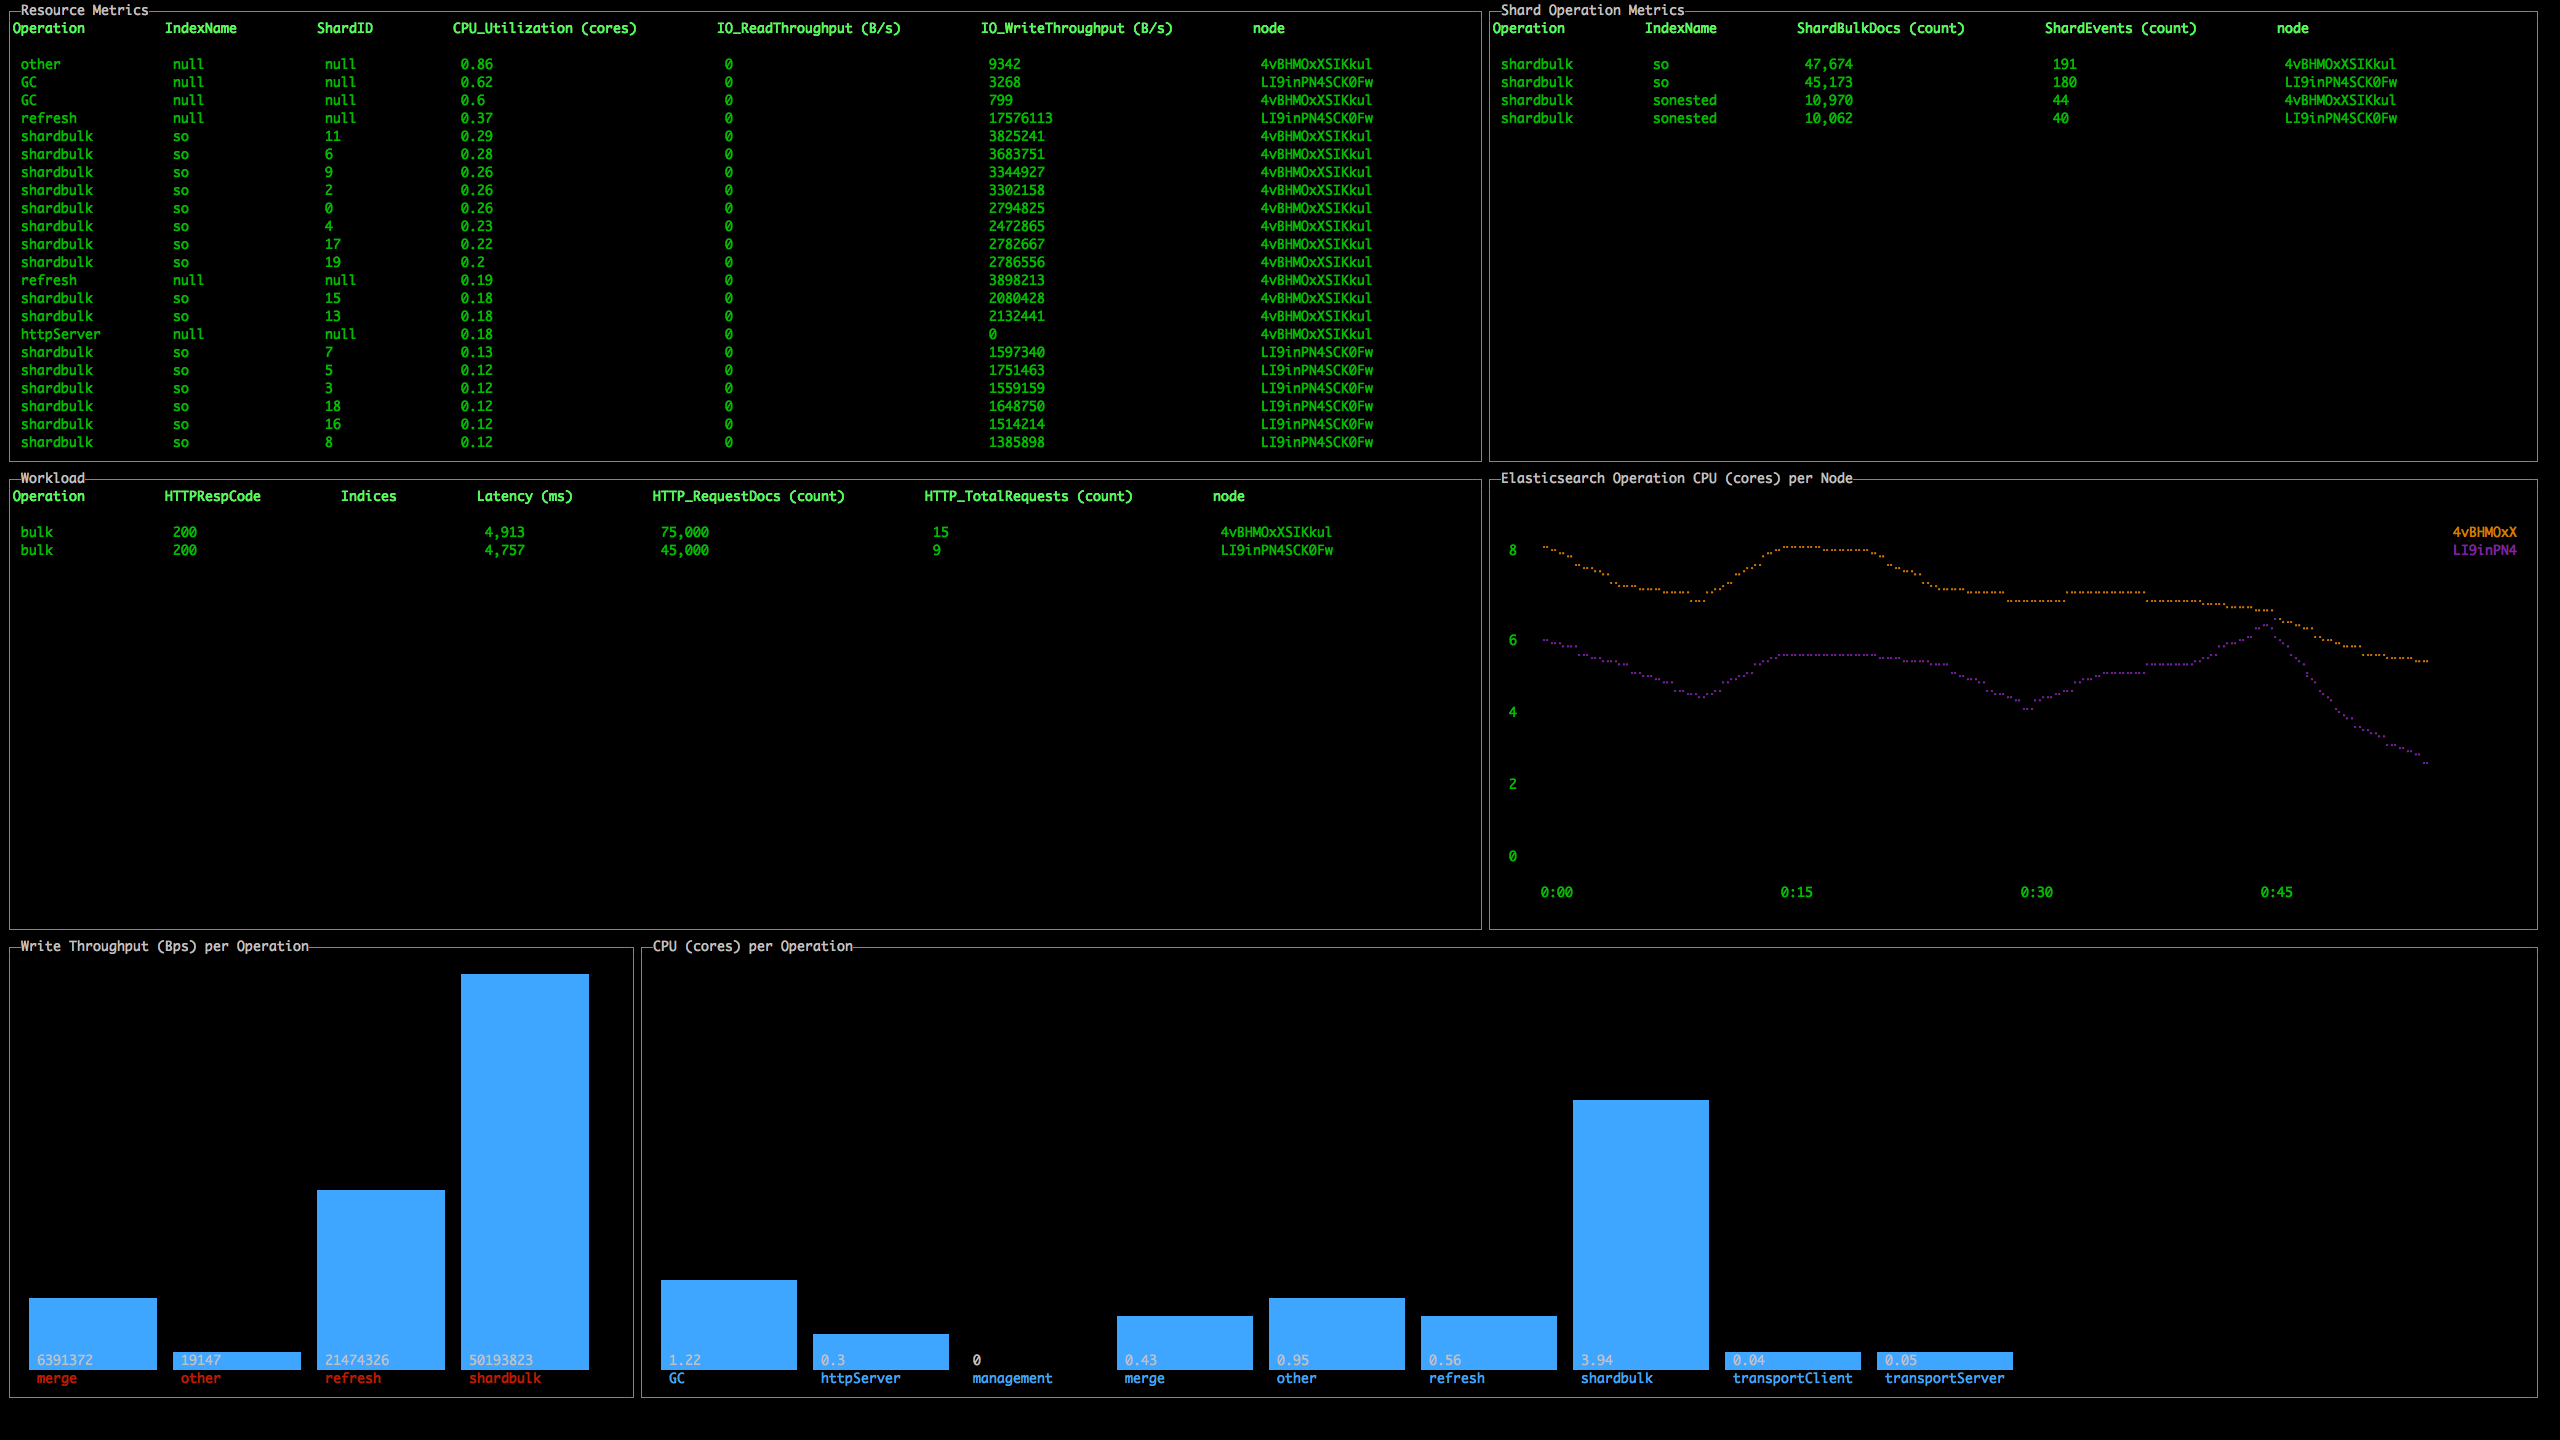
Get started with PerfTop
The basic syntax is:
./perf-top-<operating_system> --dashboard <dashboard>.json --endpoint <endpoint>
If you’re using npm, the syntax is similar:
perf-top --dashboard <dashboard> --endpoint <endpoint>
If you’re running PerfTop from a node (i.e. locally), specify port 9600:
./perf-top-linux --dashboard dashboards/<dashboard>.json --endpoint localhost:9600
Otherwise, just specify the Elasticsearch endpoint:
./perf-top-macos --dashboard dashboards/<dashboard>.json --endpoint my-cluster.my-domain.com
PerfTop has four pre-built dashboards in the dashboards directory, but you can also create your own.
You can also load the pre-built dashboards (ClusterOverview, ClusterNetworkMemoryAnalysis, ClusterThreadAnalysis, or NodeAnalysis) without the JSON files, such as --dashboard ClusterThreadAnalysis.
PerfTop has no interactivity. Start the application, monitor the dashboard, and press esc, q, or Ctrl + C to quit.
Other options
- For NodeAnalysis and similar custom dashboards, you can add the
--nodename <node_name>argument if you want your dashboard to display metrics for only a single node. - For troubleshooting, add the
--logfile <log-file>.txtargument.