The Open Distro project is archived. Open Distro development has moved to OpenSearch. The Open Distro plugins will continue to work with legacy versions of Elasticsearch OSS, but we recommend upgrading to OpenSearch to take advantage of the latest features and improvements.
Performance Analyzer
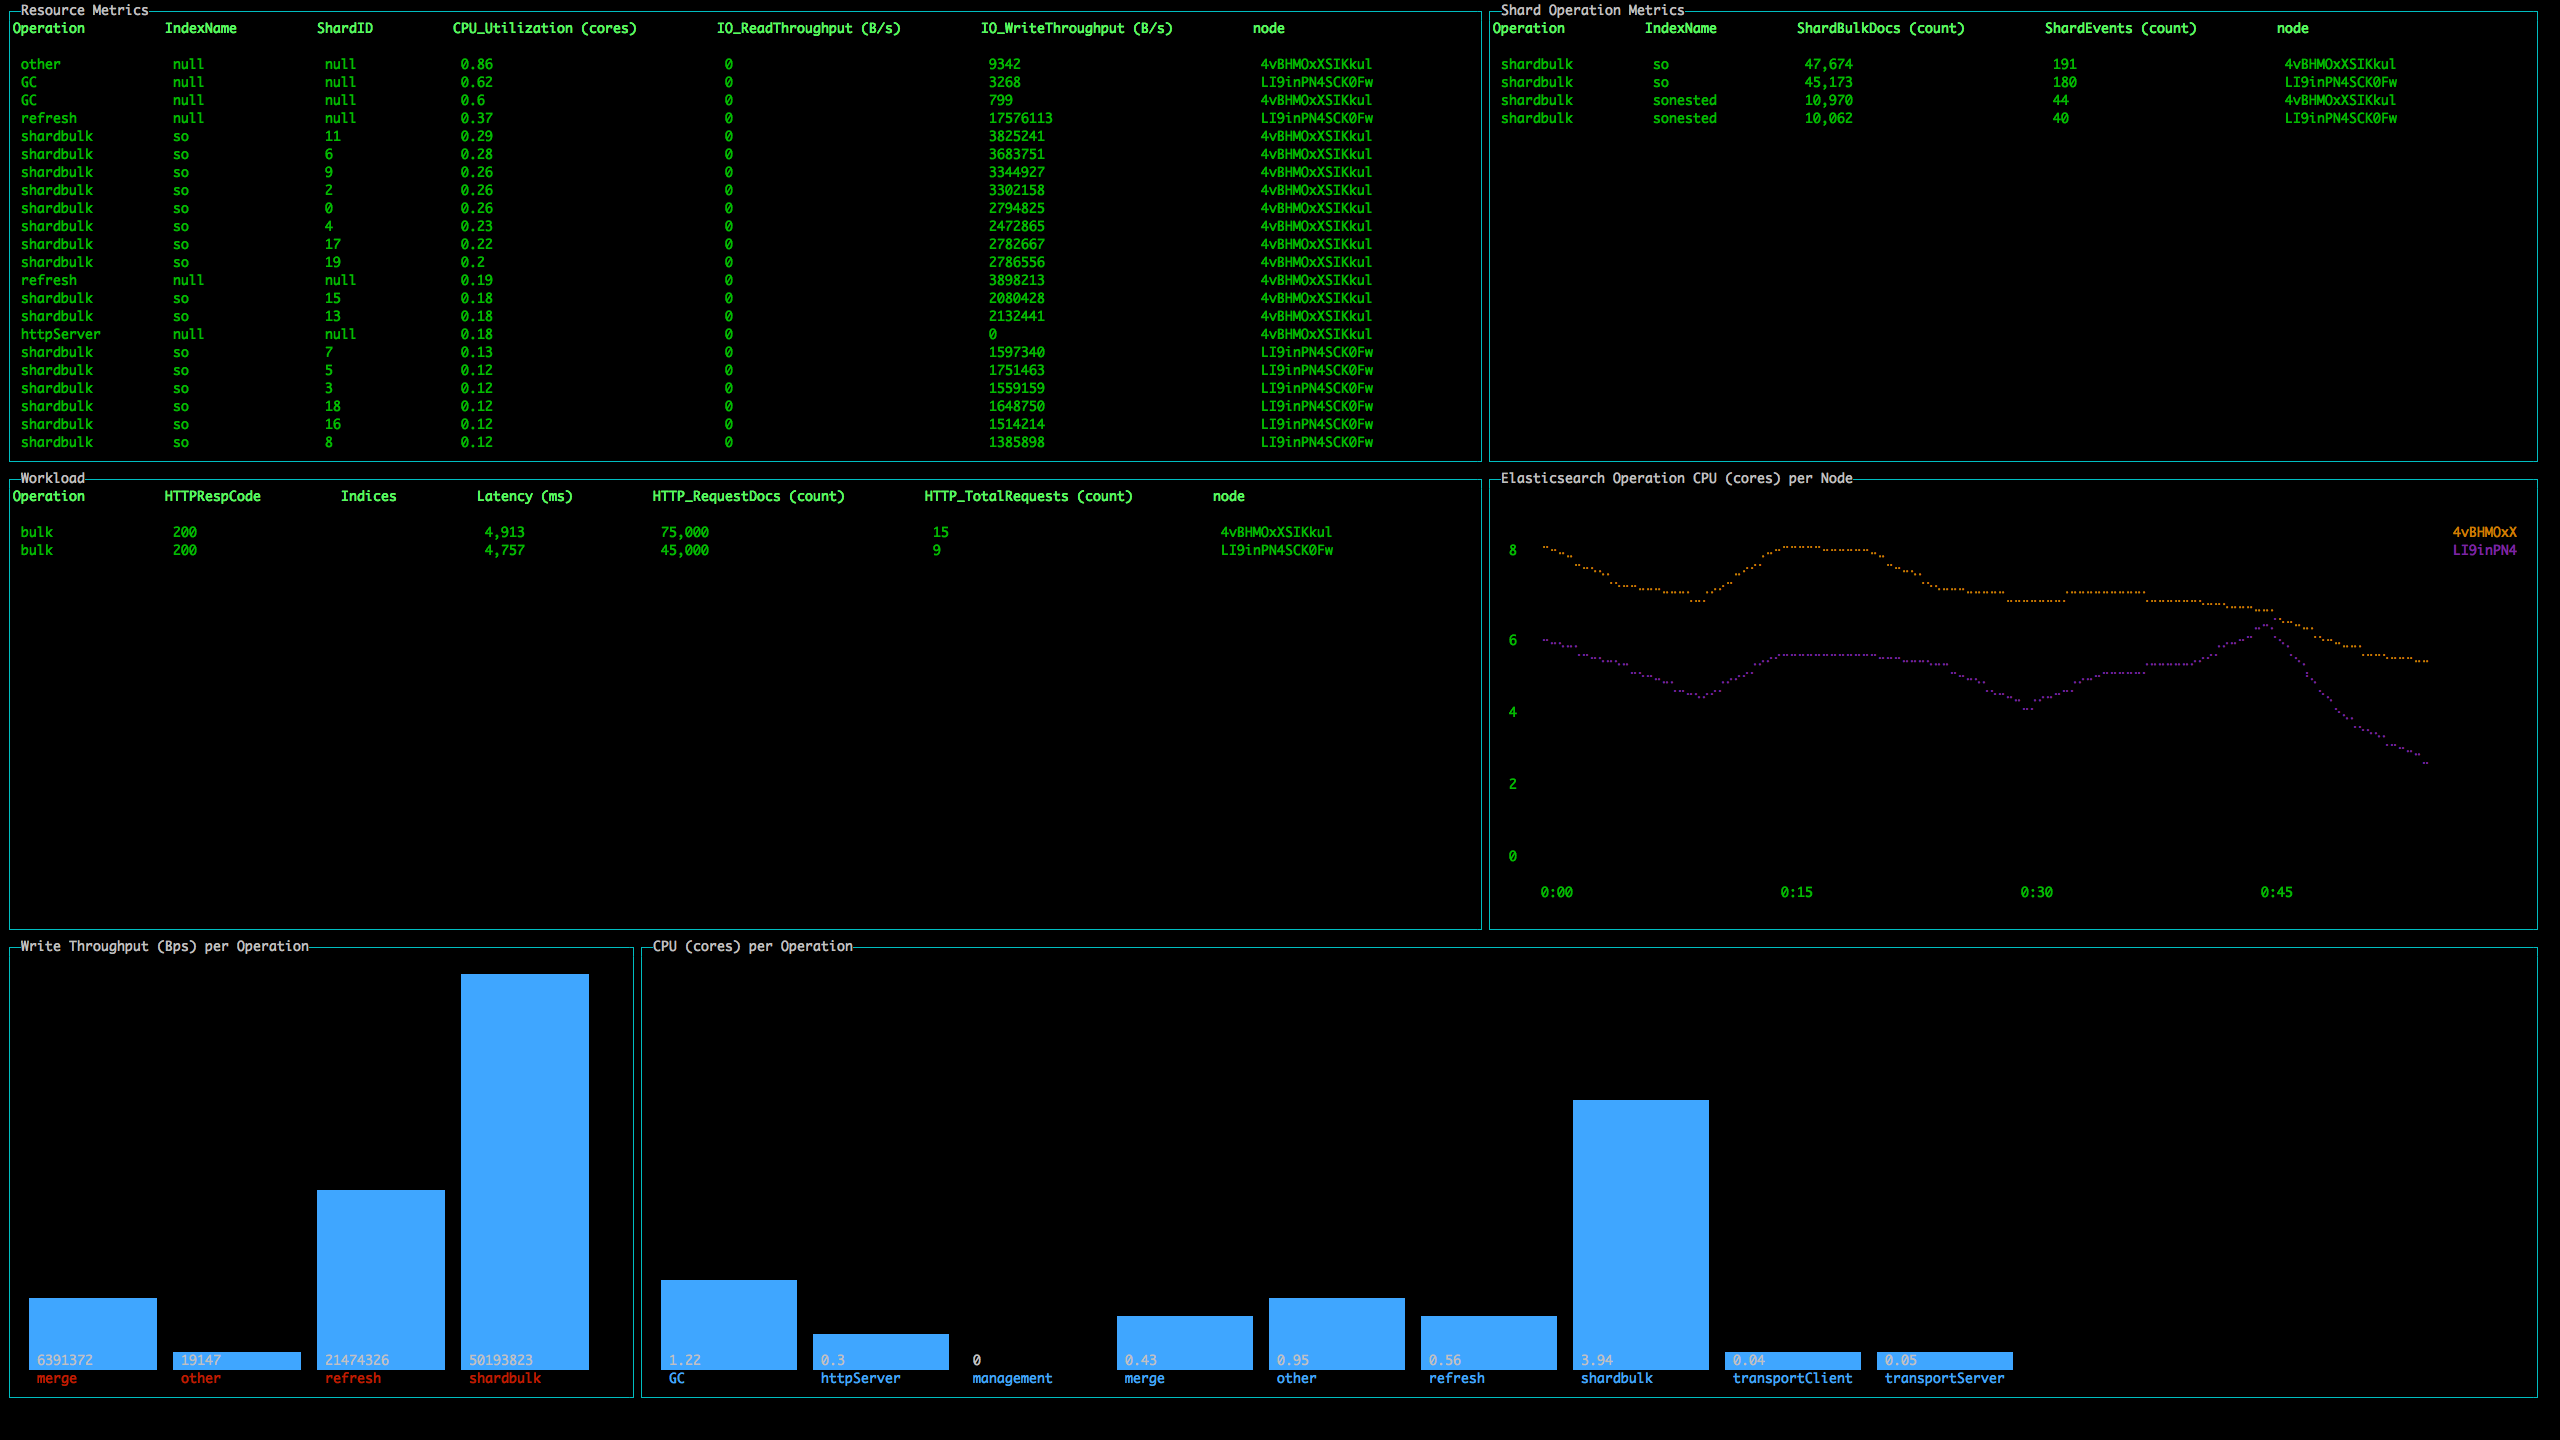
Performance Analyzer is an agent and REST API that allows you to query numerous performance metrics for your cluster, including aggregations of those metrics, independent of the Java Virtual Machine (JVM). PerfTop is the default command line interface (CLI) for displaying those metrics.
To download PerfTop, see Download on the Open Distro website.
You can also install it using npm:
npm install -g @aws/opendistro-for-elasticsearch-perftop

Get started with PerfTop
The basic syntax is:
./perf-top-<operating_system> --dashboard <dashboard>.json --endpoint <endpoint>
If you’re using npm, the syntax is similar:
perf-top --dashboard <dashboard> --endpoint <endpoint>
If you’re running PerfTop from a node (i.e. locally), specify port 9600:
./perf-top-linux --dashboard dashboards/<dashboard>.json --endpoint localhost:9600
Otherwise, just specify the Elasticsearch OSS endpoint:
./perf-top-macos --dashboard dashboards/<dashboard>.json --endpoint my-cluster.my-domain.com
PerfTop has four pre-built dashboards in the dashboards directory, but you can also create your own.
You can also load the pre-built dashboards (ClusterOverview, ClusterNetworkMemoryAnalysis, ClusterThreadAnalysis, or NodeAnalysis) without the JSON files, such as --dashboard ClusterThreadAnalysis.
PerfTop has no interactivity. Start the application, monitor the dashboard, and press esc, q, or Ctrl + C to quit.
Other options
- For NodeAnalysis and similar custom dashboards, you can add the
--nodename <node_name>argument if you want your dashboard to display metrics for only a single node. - For troubleshooting, add the
--logfile <log-file>.txtargument.
Performance Analyzer configuration
Storage
Performance Analyzer uses /dev/shm for temporary storage. During heavy workloads on a cluster, Performance Analyzer can use up to 1 GB of space.
Docker, however, has a default /dev/shm size of 64 MB. To change this value, you can use the docker run --shm-size 1gb flag or a similar setting in Docker Compose.
If you’re not using Docker, check the size of /dev/shm using df -h. The default value is probably plenty, but if you need to change its size, add the following line to /etc/fstab:
tmpfs /dev/shm tmpfs defaults,noexec,nosuid,size=1G 0 0
Then remount the file system:
mount -o remount /dev/shm
Security
Performance Analyzer supports encryption in transit for requests. It currently does not support client or server authentication for requests. To enable encryption in transit, edit performance-analyzer.properties in your $ES_HOME directory:
vi $ES_HOME/plugins/opendistro_performance_analyzer/pa_config/performance-analyzer.properties
Change the following lines to configure encryption in transit. Note that certificate-file-path must be a certificate for the server, not a root CA:
https-enabled = true

#Setup the correct path for certificates
certificate-file-path = specify_path

private-key-file-path = specify_path