The Open Distro project is archived. Open Distro development has moved to OpenSearch. The Open Distro plugins will continue to work with legacy versions of Elasticsearch OSS, but we recommend upgrading to OpenSearch to take advantage of the latest features and improvements.
Trace Analytics Kibana plugin
The Trace Analytics Kibana plugin provides at-a-glance visibility into your application performance, along with the ability to drill down on individual traces. For installation instructions, see Standalone Kibana plugin install.
The Dashboard view groups traces together by HTTP method and path so that you can see the average latency, error rate, and trends associated with a particular operation. For a more focused view, try filtering by trace group name.
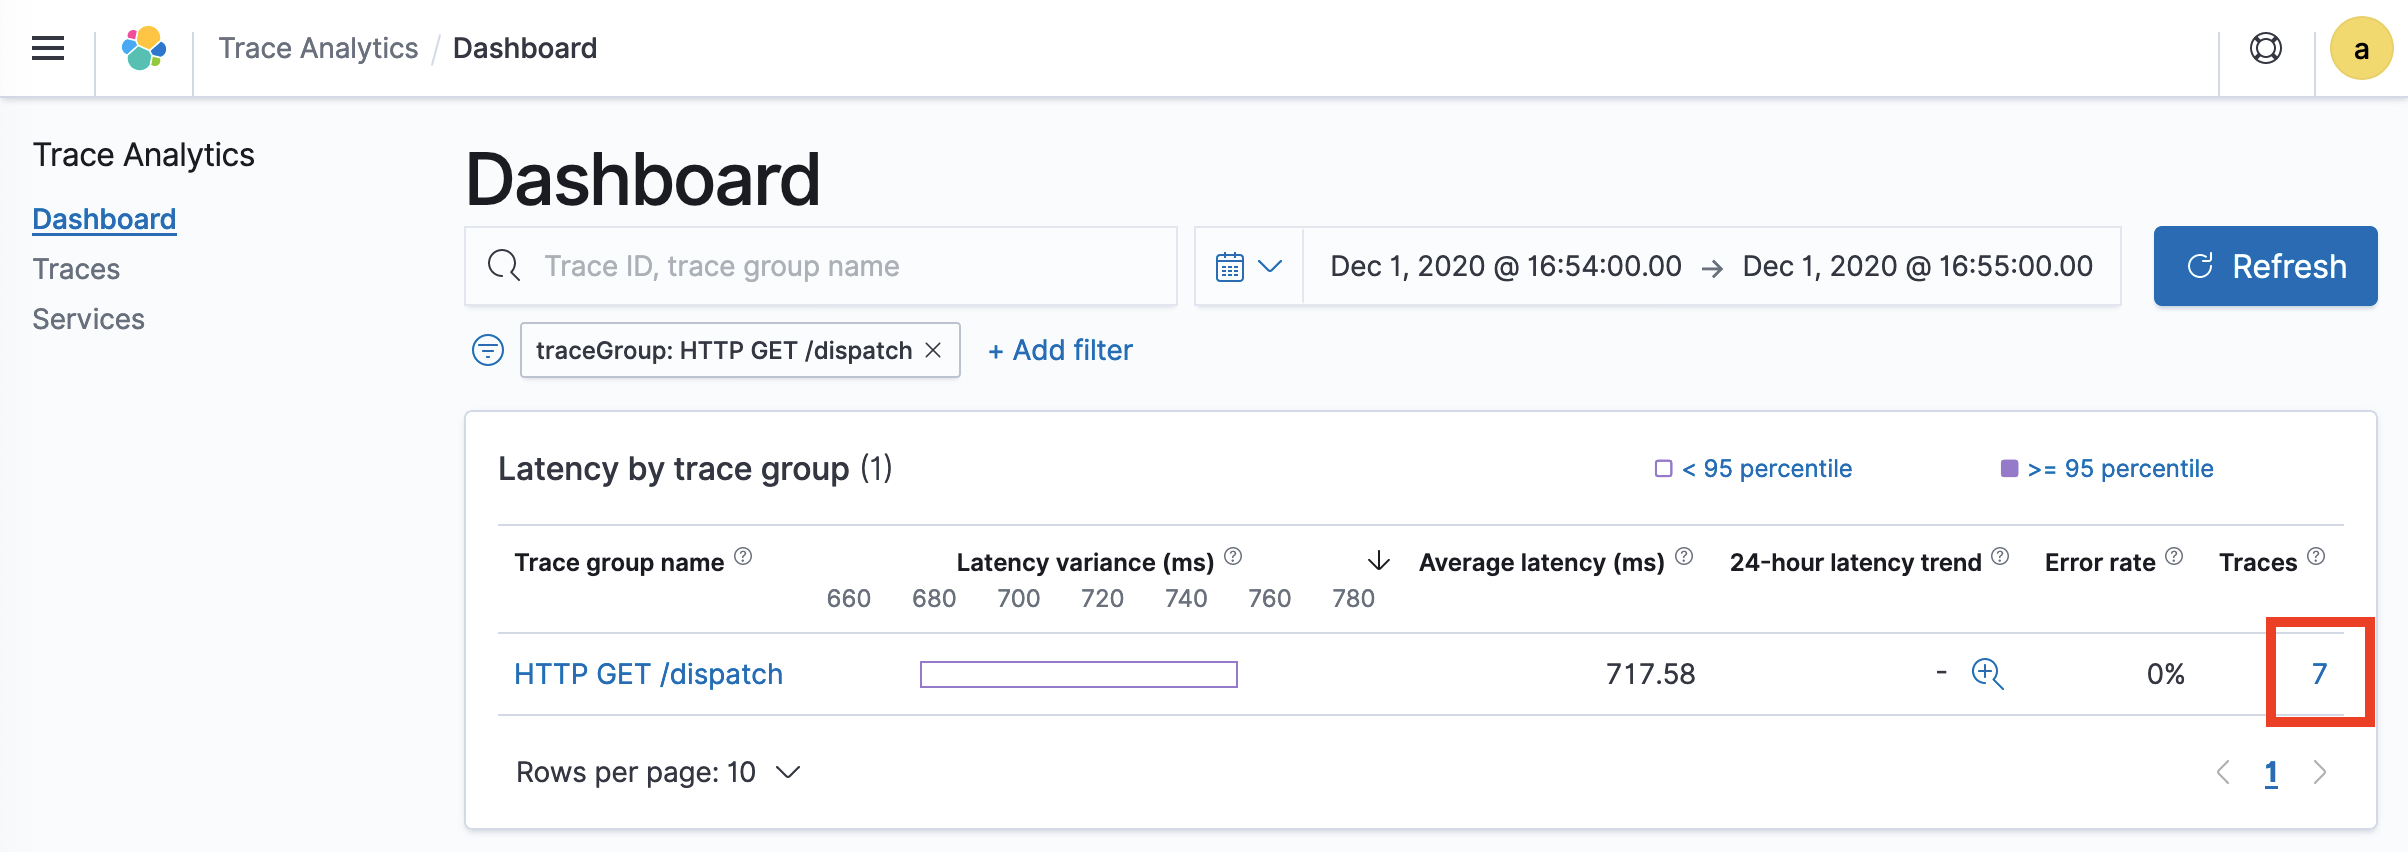
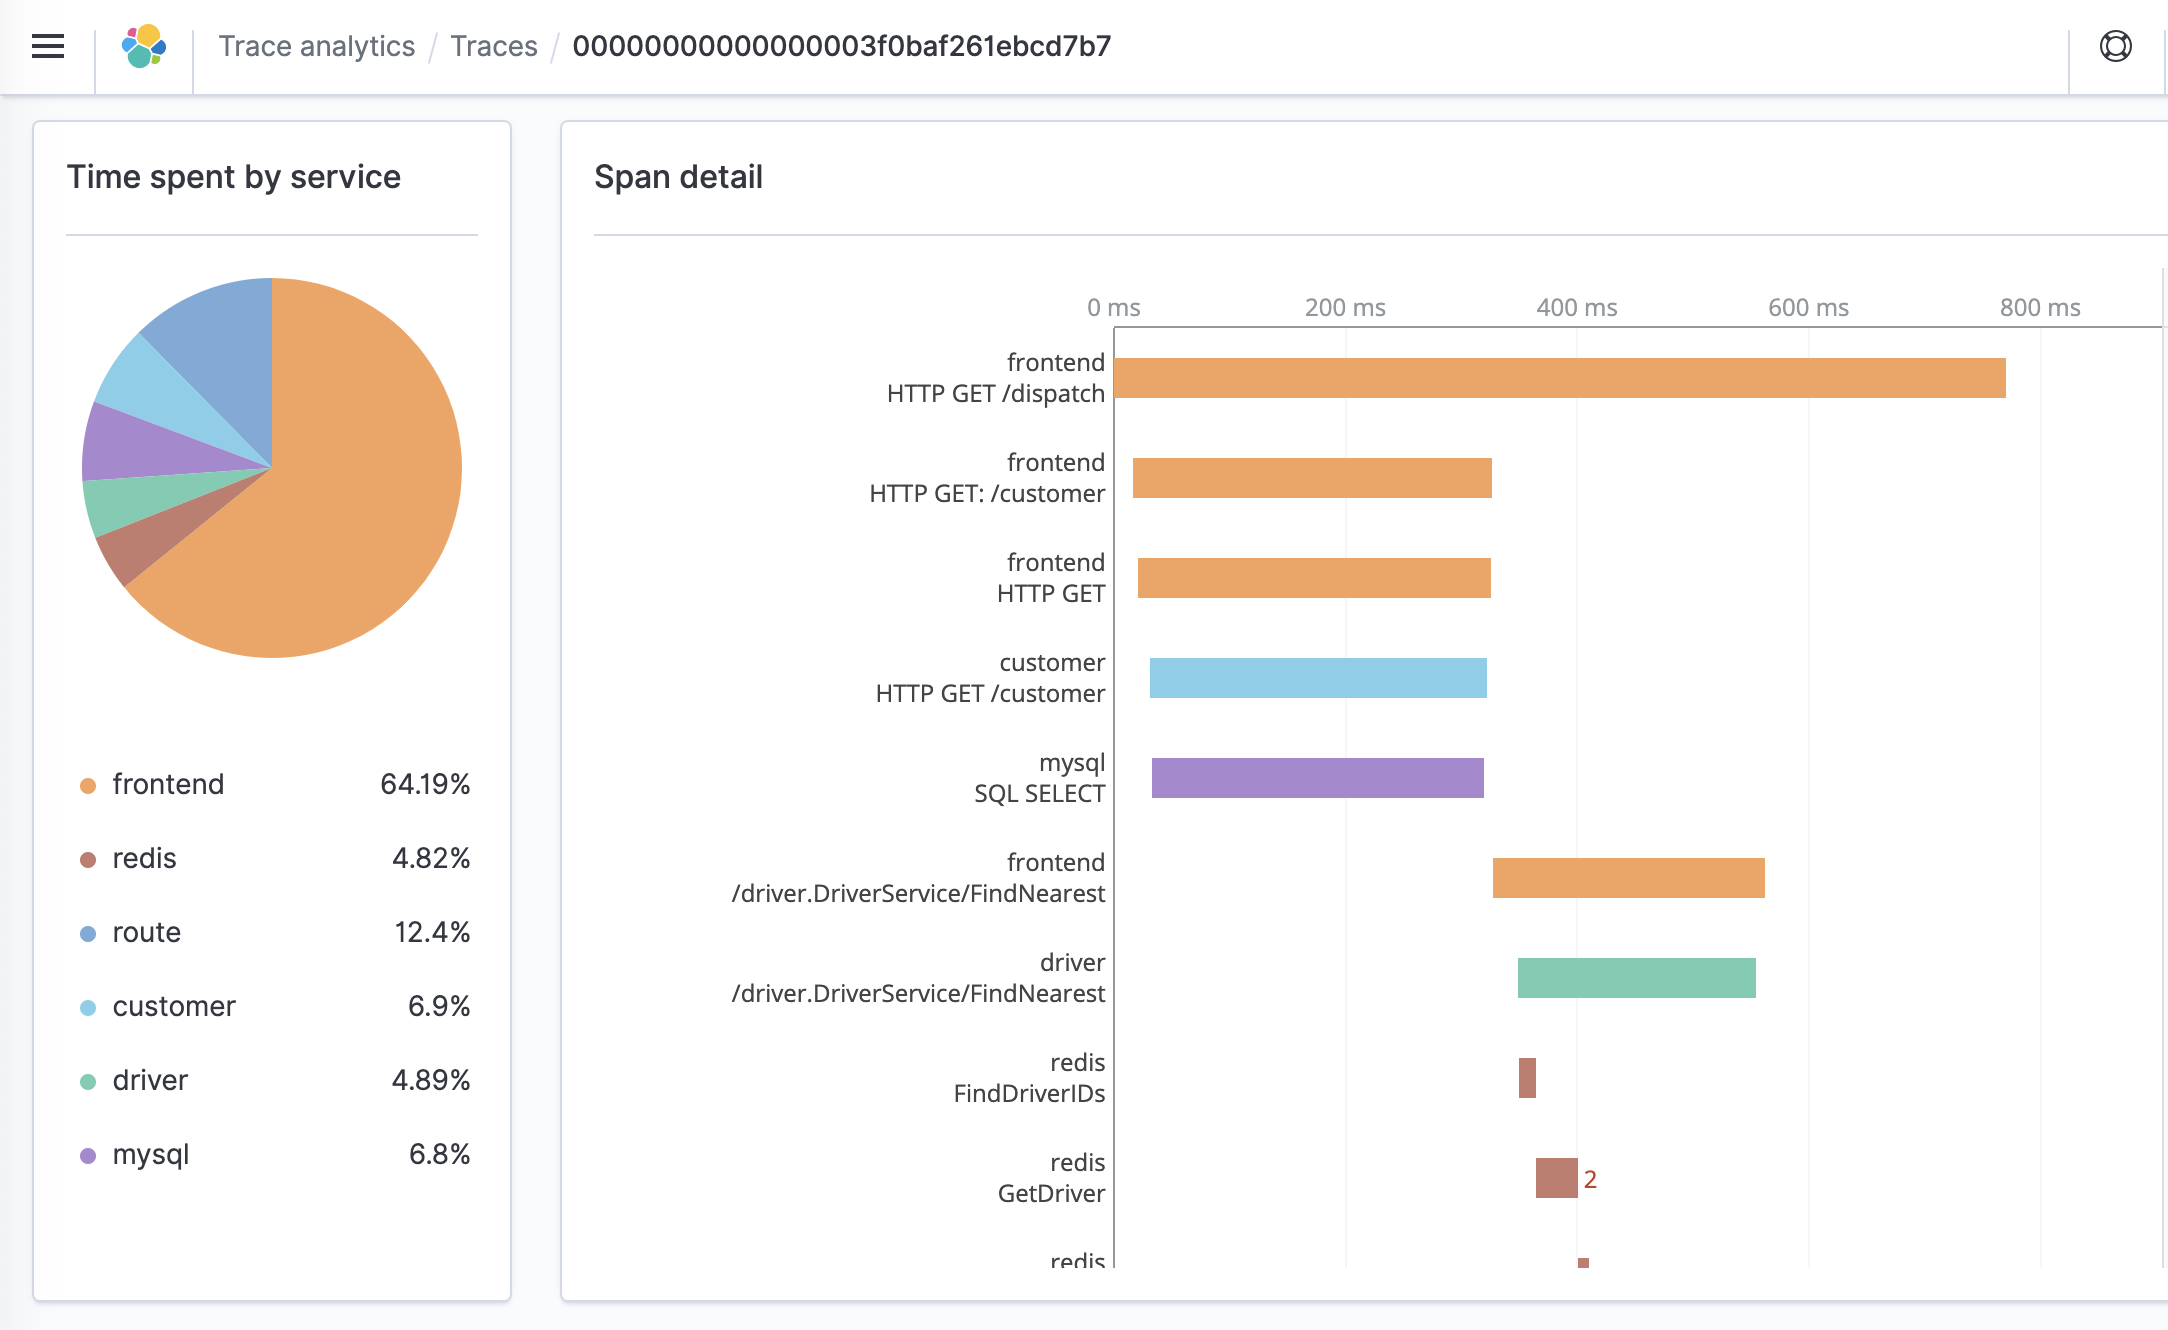
To drill down on the traces that make up a trace group, choose the number of traces in righthand column. Then choose an individual trace for a detailed summary.
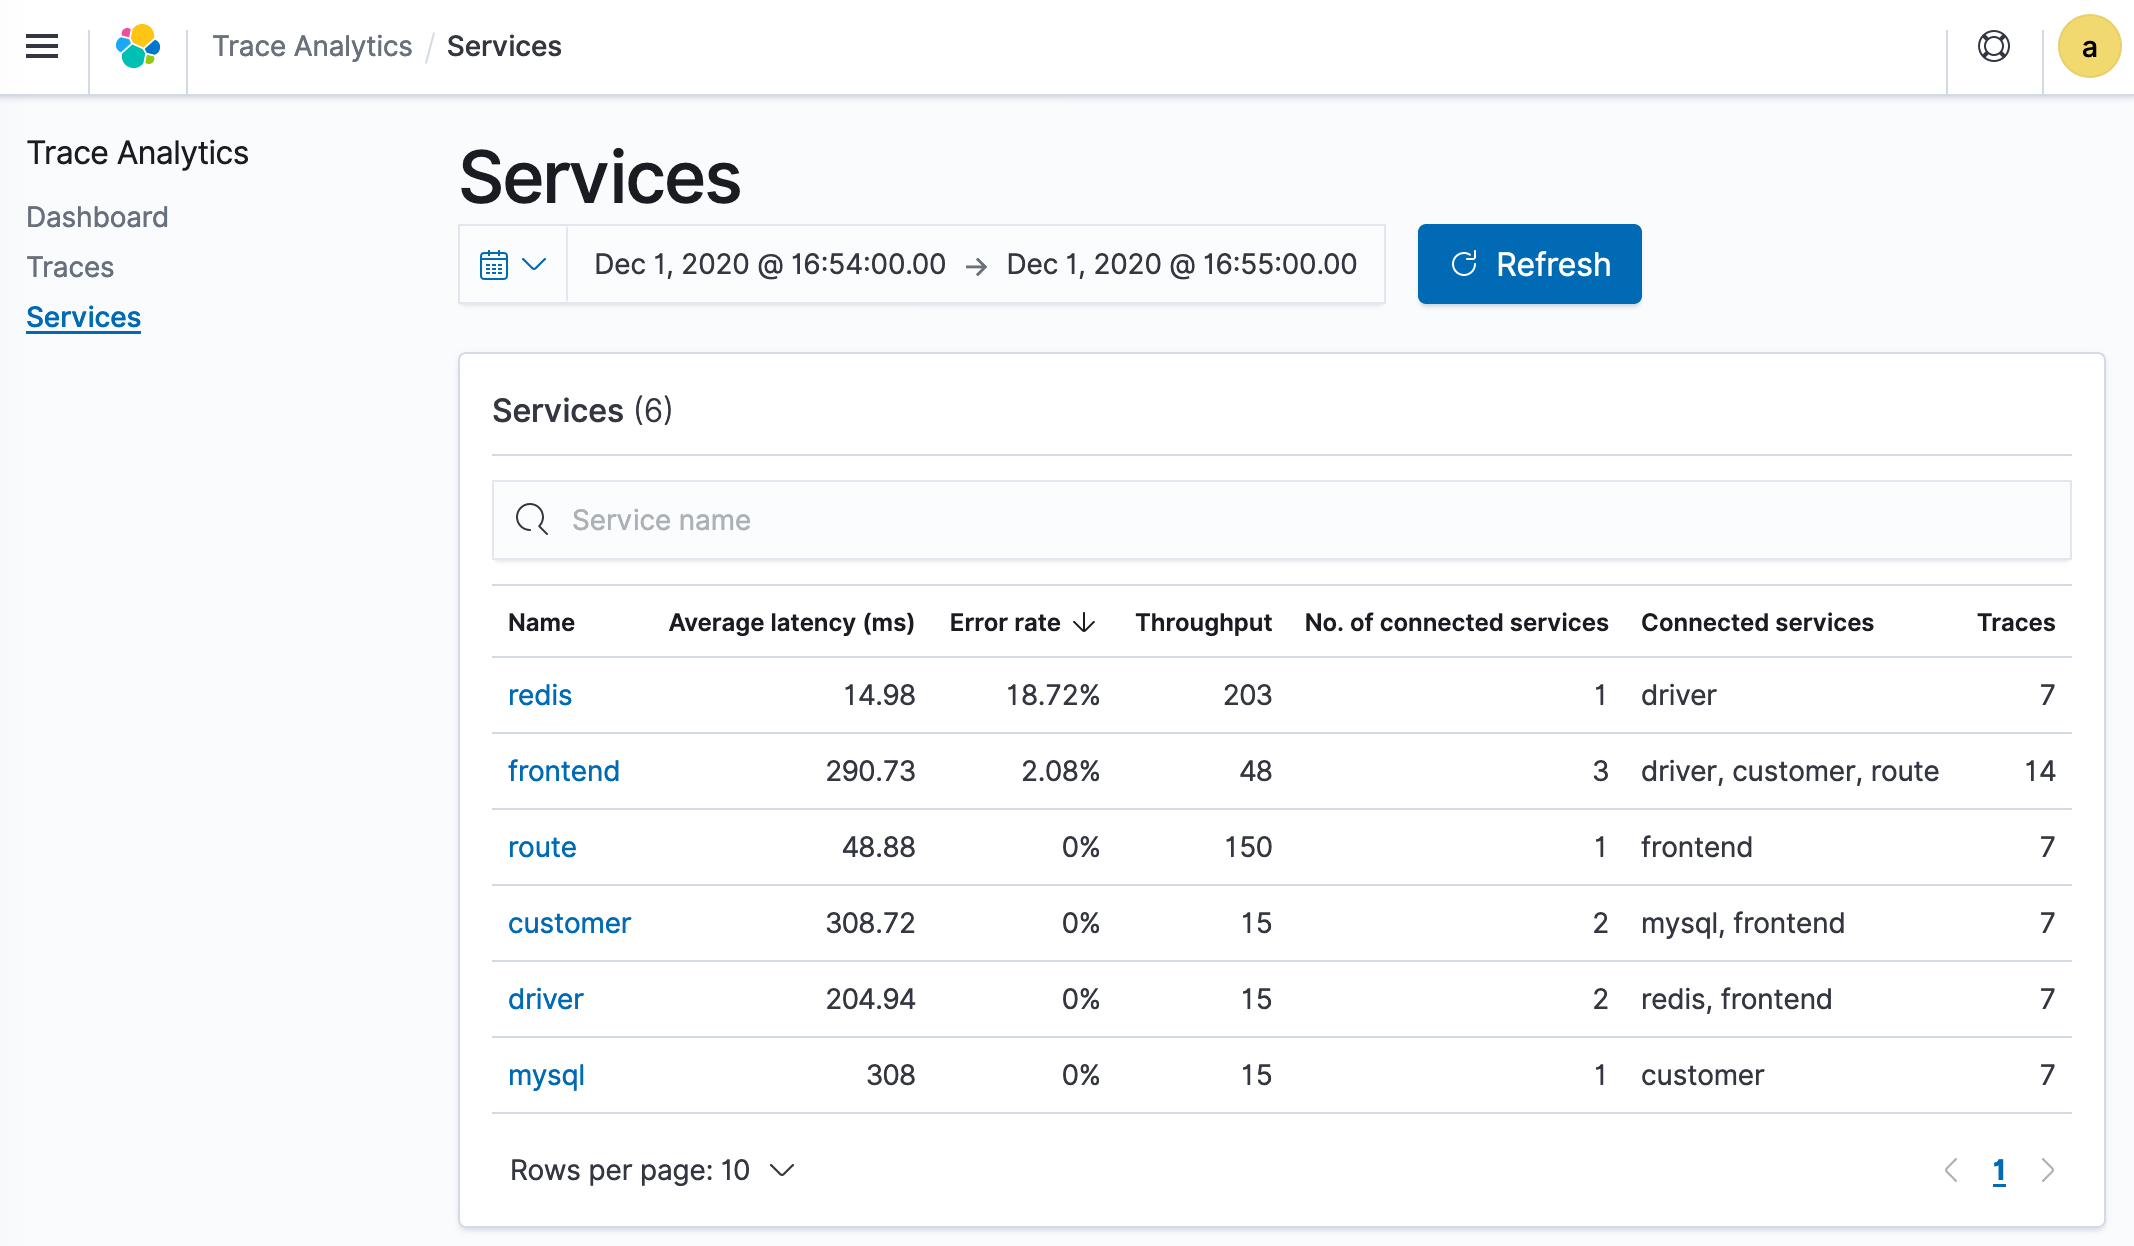
The Services view lists all services in the application, plus an interactive map that shows how the various services connect to each other. In contrast to the dashboard, which helps identify problems by operation, the service map helps identify problems by service. Try sorting by error rate or latency to get a sense of potential problem areas of your application.