The Open Distro project is archived. Open Distro development has moved to OpenSearch. The Open Distro plugins will continue to work with legacy versions of Elasticsearch OSS, but we recommend upgrading to OpenSearch to take advantage of the latest features and improvements.
Get started with Trace Analytics
Open Distro Trace Analytics consists of two components—Data Prepper and the Trace Analytics Kibana plugin—that fit into the OpenTelemetry and Elasticsearch ecosystems. The Data Prepper repository has several sample applications to help you get started.
Basic flow of data

-
Trace Analytics relies on you adding instrumentation to your application and generating trace data. The OpenTelemetry documentation contains example applications for many programming languages that can help you get started, including Java, Python, Go, and JavaScript.
(In the Jaeger HotROD example below, an extra component, the Jaeger agent, runs alongside the application and sends the data to the OpenTelemetry Collector, but the concept is similar.)
-
The OpenTelemetry Collector receives data from the application and formats it into OpenTelemetry data.
-
Data Prepper processes the OpenTelemetry data, transforms it for use in Open Distro, and indexes it on an Elasticsearch cluster.
-
The Trace Analytics Kibana plugin displays the data in near real-time as a series of charts and tables, with an emphasis on service architecture, latency, error rate, and throughput.
Jaeger HotROD
One Trace Analytics sample application is the Jaeger HotROD demo, which mimics the flow of data through a distributed application.
Download or clone the Data Prepper repository. Then navigate to examples/jaeger-hotrod/ and open docker-compose.yml in a text editor. This file contains a container for each element from Basic flow of data:
- A distributed application (
jaeger-hot-rod) with the Jaeger agent (jaeger-agent) - The OpenTelemetry Collector (
otel-collector) - Data Prepper (
data-prepper) - A single-node Open Distro cluster (
opendistro) - Kibana (
kibana).
Close the file and run docker-compose up --build. After the containers start, navigate to http://localhost:8080 in a web browser.
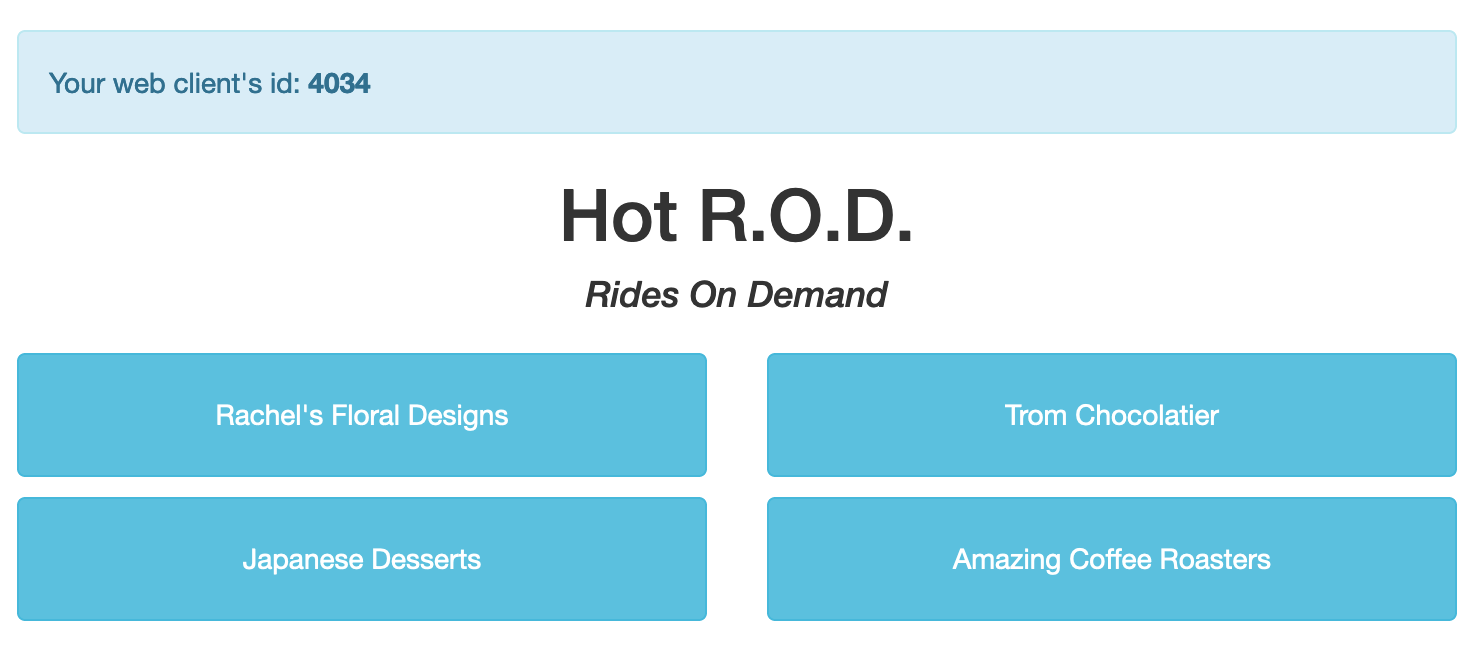
Click one of the buttons in the web interface to send a request to the application. Each request starts a series of operations across the services that make up the application. From the console logs, you can see that these operations share the same trace-id, which lets you track all of the operations in the request as a single trace:
jaeger-hot-rod  | http://0.0.0.0:8081/customer?customer=392
jaeger-hot-rod  | 2020-11-19T16:29:53.425Z	INFO	frontend/server.go:92	HTTP request received	{"service": "frontend", "trace_id": "12091bd60f45ea2c", "span_id": "12091bd60f45ea2c", "method": "GET", "url": "/dispatch?customer=392&nonse=0.6509021735471818"}
jaeger-hot-rod  | 2020-11-19T16:29:53.426Z	INFO	customer/client.go:54	Getting customer{"service": "frontend", "component": "customer_client", "trace_id": "12091bd60f45ea2c", "span_id": "12091bd60f45ea2c", "customer_id": "392"}
jaeger-hot-rod  | 2020-11-19T16:29:53.430Z	INFO	customer/server.go:67	HTTP request received	{"service": "customer", "trace_id": "12091bd60f45ea2c", "span_id": "252ff7d0e1ac533b", "method": "GET", "url": "/customer?customer=392"}
jaeger-hot-rod  | 2020-11-19T16:29:53.430Z	INFO	customer/database.go:73	Loading customer{"service": "customer", "component": "mysql", "trace_id": "12091bd60f45ea2c", "span_id": "252ff7d0e1ac533b", "customer_id": "392"}
These operations also have a span_id. Spans are units of work from a single service. Each trace contains some number of spans. Shortly after the application starts processing the request, you can see the OpenTelemetry Collector starts exporting the spans:
otel-collector  | 2020-11-19T16:29:53.781Z	INFO	loggingexporter/logging_exporter.go:296	TraceExporter	{"#spans": 1}
otel-collector  | 2020-11-19T16:29:53.787Z	INFO	loggingexporter/logging_exporter.go:296	TraceExporter	{"#spans": 3}
Then Data Prepper processes the data from the OpenTelemetry Collector and indexes it:
data-prepper  | 1031918 [service-map-pipeline-process-worker-2-thread-1] INFO  com.amazon.dataprepper.pipeline.ProcessWorker  –  service-map-pipeline Worker: Processing 3 records from buffer
data-prepper  | 1031923 [entry-pipeline-process-worker-1-thread-1] INFO  com.amazon.dataprepper.pipeline.ProcessWorker  –  entry-pipeline Worker: Processing 1 records from buffer
Finally, you can see the Open Distro node responding to the indexing request.
node-0.example.com  | [2020-11-19T16:29:55,064][INFO ][o.e.c.m.MetadataMappingService] [9fb4fb37a516] [otel-v1-apm-span-000001/NGYbmVD9RmmqnxjfTzBQsQ] update_mapping [_doc]
node-0.example.com  | [2020-11-19T16:29:55,267][INFO ][o.e.c.m.MetadataMappingService] [9fb4fb37a516] [otel-v1-apm-span-000001/NGYbmVD9RmmqnxjfTzBQsQ] update_mapping [_doc]
In a new terminal window, run the following command to see one of the raw documents in the Elasticsearch cluster:
curl -X GET -u 'admin:admin' -k 'https://localhost:9200/otel-v1-apm-span-000001/_search?pretty&size=1'
Navigate to http://localhost:5601 in a web browser and choose Trace Analytics. You can see the results of your single click in the Jaeger HotROD web interface: the number of traces per API and HTTP method, latency trends, a color-coded map of the service architecture, and a list of trace IDs that you can use to drill down on individual operations.
If you don’t see your trace, adjust the timeframe in Kibana. For more information on using the plugin, see Kibana plugin.